eLitmus Data Interpretation: Choose the Right Set and Control Accuracy
Learn a repeatable DI routine: score each set before solving, compress the data into one scratch table, protect every percentage base, and verify results early.
KnowledgeGate Team
Exam prep & CS education
Updated 27 Aug 20266 min read
A dense DI set can consume several minutes before you discover that every question depends on awkward conversions. A plainer set may offer cleaner answers. Use a repeatable three-part method: score the set before solving, turn the source into a compact scratch table, and verify the base of every percentage. Start with 75 seconds for triage, then tune that checkpoint from your own mock evidence.
eLitmus data interpretation starts before the first calculation
Every DI set has three layers:
Representation layer: the table, chart or caselet presenting the information.
Data layer: the totals, percentages, ratios and units.
Question layer: independent questions, or a chain in which one result feeds the next.
The official pH Test information for test takers says eLitmus supplies required formulae and considers correctness and question difficulty in the final score. For DI, that shifts practice away from formula recall and towards representation, dependency control and clean execution.
Visual density is not the same as arithmetic difficulty. A large table with visible totals and direct comparisons can be easier than a short caselet that hides the base of a percentage.
A good first set has visible bases, friendly conversions and mostly independent questions. A dangerous first set mixes units, hides a denominator or demands two or more derived values before you can check even one answer.
Strong aptitude for placements across quant, reasoning and verbal makes that judgement faster. Percentage, ratio, average and unit-conversion fluency form the base beneath DI.
eLitmus DI set triage: use a 10-point practice score
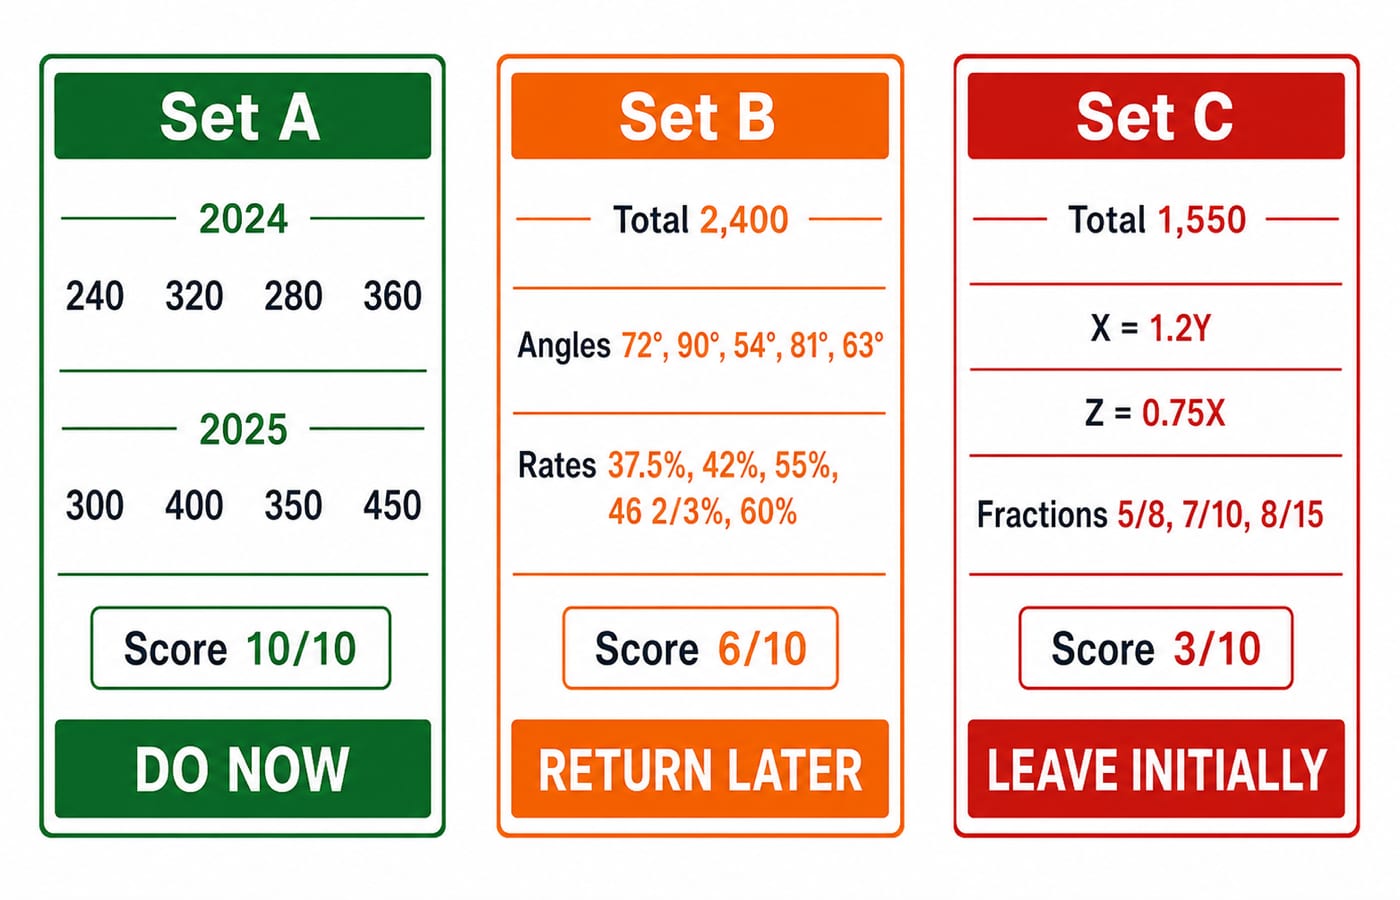
During practice, scan three sets for 75 seconds. Give each 0, 1 or 2 points for data readability, derivation layers, arithmetic friendliness, question independence and familiarity.
8 to 10: start now.
5 to 7: return after the clean set.
0 to 4: leave initially.
Use the 75-second scan and score bands as starting points. After three mocks, adjust them using your setup time, questions reached and base-error count.
Set | Source and likely work | Score | Decision |
|---|---|---|---|
A | Direct two-year table. 2024: 240, 320, 280, 360. 2025: 300, 400, 350, 450. Needs totals, percentage change and a ratio. | 2+2+2+2+2 = 10/10 | Do now |
B | Pie chart of 2,400 applicants. Angles: 72°, 90°, 54°, 81°, 63°. Selection rates: 37.5%, 42%, 55%, 46 2/3%, 60%. Needs angle-to-count conversion, then a percentage. | 1+1+1+2+1 = 6/10 | Return later |
C | Caselet with total 1,550, X = 1.2Y, Z = 0.75X, then fractions 5/8, 7/10, 8/15. The hidden base creates dependency. | 0+0+1+0+2 = 3/10 | Leave initially |
Choose A, park B and leave C on the first pass.
Build one scratch table and lock every percentage base
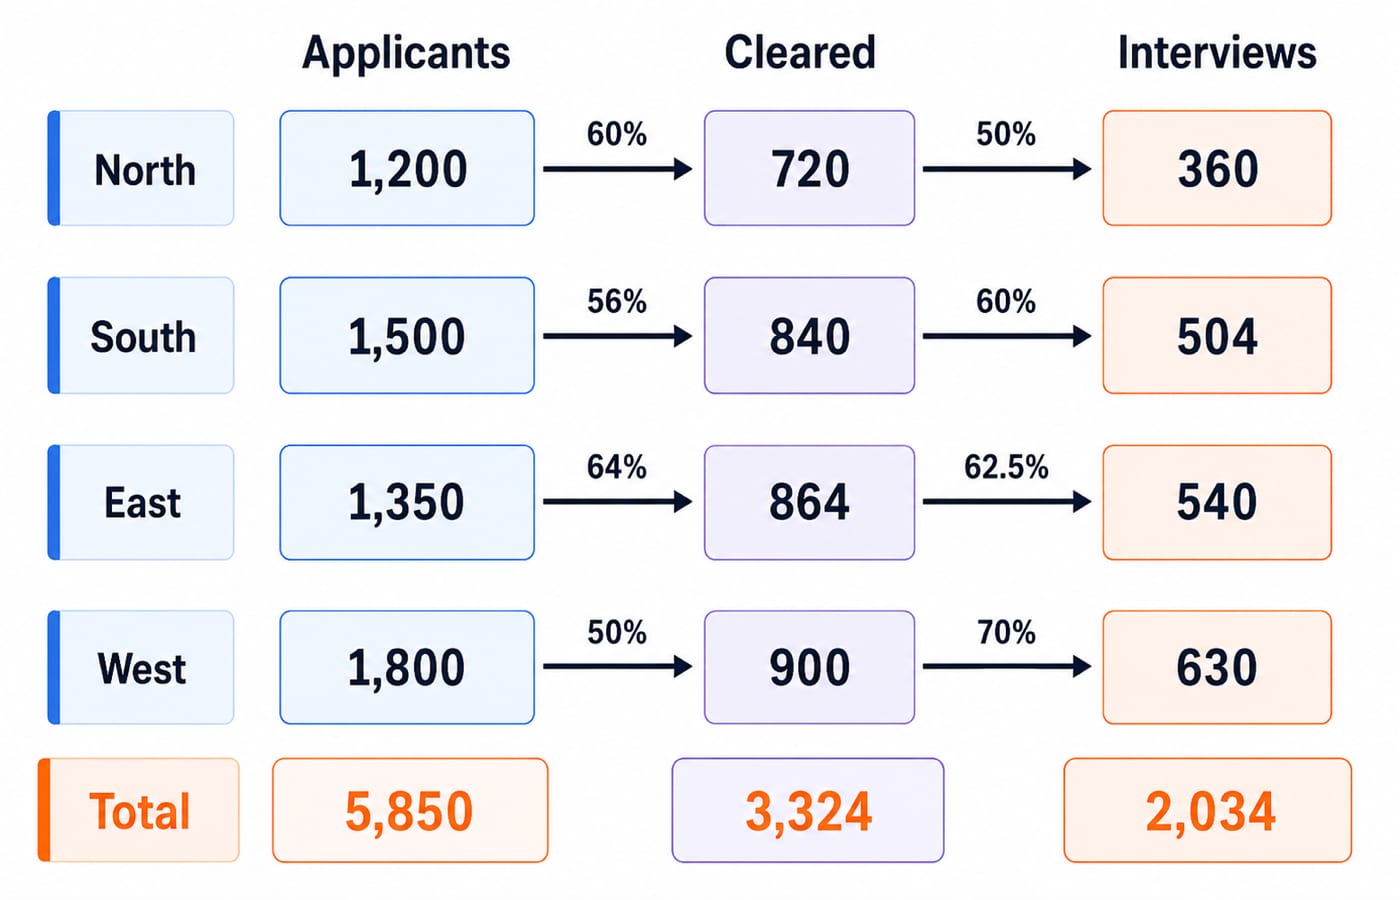
Consider a four-region hiring funnel. North has 1,200 applicants, 60% clear aptitude, and 50% of those cleared reach interview. South has 1,500 applicants, with rates of 56% and 60%. East has 1,350, with 64% and 62.5%. West has 1,800, with 50% and 70%.
Write the two formulas before touching the rows:
Cleared = Applicants × clear rate
Interview = Cleared × interview rate
The base of the second percentage is the cleared count, not the original applicant count. Convert friendly percentages first: 56% = 14/25, 62.5% = 5/8, 50% = 1/2, 60% = 3/5, and 70% = 7/10.
Region | Applicants | Aptitude-clear rate | Cleared count | Interview rate among cleared | Interview count |
|---|---|---|---|---|---|
North | 1,200 | 60% | 720 | 50% | 360 |
South | 1,500 | 56% | 840 | 60% | 504 |
East | 1,350 | 64% | 864 | 62.5% | 540 |
West | 1,800 | 50% | 900 | 70% | 630 |
eLitmus data interpretation worked example: solve the hiring funnel
Compute each row in two stages:
North:
1,200 × 60% = 720; then720 × 50% = 360.South:
1,500 × 14/25 = 840; then840 × 3/5 = 504.East:
1,350 × 64% = 864; then864 × 5/8 = 540.West:
1,800 × 1/2 = 900; then900 × 7/10 = 630.
Now answer four common question types.
Total interview candidates:
360 + 504 + 540 + 630 = 2,034.Percentage by which South exceeds North:
(504 - 360) / 360 × 100 = 40%.East-to-West interview ratio:
540:630 = 6:7after division by 90.Combined East-and-West interview conversion:
(540 + 630) / (1,350 + 1,800) = 1,170 / 3,150 = 13/35 = 37 1/7%. Only at the final step should this become approximately37.14%.
Accuracy checkpoints that catch a wrong DI answer early
Use the same values to run three quick checks.
Direction check: every row satisfies
Interview ≤ Cleared ≤ Applicants.Column check: cleared total is
720 + 840 + 864 + 900 = 3,324, while interview total is2,034.Reverse check: for South,
504 ÷ 0.60 = 840, then840 ÷ 0.56 = 1,500. The source value returns exactly.
Question 4 also permits a weighted-average check. East converts 540/1,350 = 40% of applicants to interviews, while West converts 630/1,800 = 35%. Their combined 37.14% must lie between 35% and 40%.
On rough paper, circle the base, box the unit and underline the requested comparison. For “South exceeds North,” circle North before writing the fraction because North is the denominator.
DI traps: wrong bases, chained percentages and premature rounding
The denominator can reverse the meaning. (504 - 360) / 504 × 100 ≈ 28.57% answers “North is what percent below South?” It does not answer “South exceeds North,” whose base is North and whose answer is 40%.
Chained rates multiply. North reaches interview at 60% × 50% = 30% of applicants, so 1,200 × 0.30 = 360. Adding the rates gives 110% and the impossible value 1,320. Also separate percentage points from percentage change: East's 64% clear rate is 4 percentage points above North's 60%, but the relative increase over North is 4/60 × 100 = 6 2/3%.
Keep 13/35 exact until the answer step, when it becomes 37.14%. Premature rounding can shift a close option. Attempting every visible question merely because it is there is one of several common placement preparation mistakes that triage prevents.
eLitmus DI practice: combine question type with set choice
The three useful families are:
Direct extraction: North's interview count is 360.
Cross-row comparison: South exceeds North by 40%.
Multi-stage synthesis: the East-West combined conversion is
13/35.
The difficulty is deciding what to derive and which denominator belongs under the comparison.
Run an 18-minute practice drill with Sets A, B and C. Spend at most 75 seconds scoring all three, solve 10/10 Set A first, then return to 6/10 Set B. If setup takes more than 2 minutes before the first answer is reachable, preserve the scratch table and switch. Record setup time, clean answers and base errors after the drill.
Before setting the next drill target, use eLitmus pH Test pattern: sections, percentile and attempt quality to separate pH Score from percentile and avoid importing rules from another platform. Then improve the weakest of three DI measures: setup time, clean answers or base errors.
The short version: triage, structure, verify
Scan the representation and dependencies.
Score the set.
Write bases and units in one scratch table.
Reverse-check one result before moving on.
Choosing Set A before Set C is part of solving, not time lost before solving.
For a focused next step, use Complete eLitmus Preparation to work through eLitmus preparation in an organised sequence. If you are still comparing hiring assessments, explore the IT Recruitment Exams category instead.
Keep learning

TCS NQT Eligibility: Check Backlogs, Gaps and Degree Rules
Use a closed TCS hiring notice as a worked checklist for degree, backlog, course-duration and academic-gap rules, then verify the current drive.
Updated 2 Sep 20264 min readIT Recruitment Exams

CoCubes Preparation Plan: Six Weeks for Campus Hiring Tests
Build a practical six-week CoCubes study plan around the modules in your own test invitation, your diagnostic results, and 72 hours of focused work.
Updated 1 Sep 20266 min readIT Recruitment Exams
eLitmus Retake Decision: Read Section Percentiles Before Testing Again
Do not retake eLitmus on disappointment alone. Use your section pattern, target-job evidence, and fresh timed practice to decide whether to go, wait, or rebuild.
Updated 30 Aug 20264 min readIT Recruitment Exams

eLitmus Mock Analysis: Diagnose Knowledge Gaps and Attempt Errors
A worked mock-review method to separate concept gaps from calculation, reading and decision errors, recover marks, and plan the next four weeks.
Updated 29 Aug 20265 min readIT Recruitment Exams