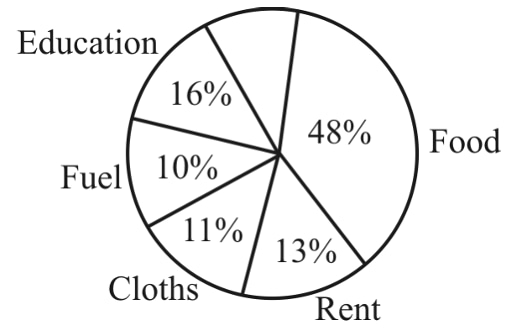
The following pie chart shows the expenditure incurred by a family in a month…
2021
The following pie chart shows the expenditure incurred by a family in a month over different heads. If the total income of a family is ₹ 35000, how much has been spent on fuel & food?
Answer: B. ₹ 20300
- A.
₹ 10700
- B.
₹ 20300
- C.
₹ 30000
- D.
₹ 34000
Attempted by 51 students.
Show answer & explanation
Correct answer: B
Loading lesson…